You can use basic math and calculations in CorelDRAW to work faster and more efficiently. Learn how to leverage CorelDraw to do the math for you. whether you're centering or resizing objects, building pie charts or bar graphs, or need a calculation to adjust your work.
Do the Math for Yourself
Basic Calculations Can Make It Possible to Work Much More Quickly in CorelDRAW
By Foster D. Coburn III
(Originally published in the March 2017 Insights)
You might believe all the math you were forced to take
in school was a complete waste of your time. Even in
CorelDRAW, the ugliest math is done for you. But there are
a large number of places you can use basic math to work
faster. For those who really hate math, the computer still
does the calculation for you!
THE PROPERTY BAR
The vast majority of math I use in CorelDRAW occurs within
the Property Bar. FIGURE 1 shows the Property Bar with
a 2-in. square selected. At left are the x and y coordinates
for the center of the object. That’s the horizontal and
vertical ruler position of the object. Then comes the height
and width of the object, shown in inches on my display
because that’s the measurement system on my installation.
The right-most values are the percentage of the height and
width from the size that was originally drawn. In this case,
I started with a 2-in.square so the 100% indicates I haven’t
changed the size yet.
Let’s say you want the square to be centered a third of the
way across the page and a third of the way from the bottom
of the page. In this case, my page size is 8.5 in. wide by 11
in. tall. I can enter 8.5/3 in the top box and 11/3 in the
bottom box, and CorelDRAW will do the math to put the
center of the object at x 2.833 and y 3.667. You could have
any size page and the basic formula is the same.
When the object is sized at 2 in. square, most of us can
easily do the math off the top of our head to double the size.
But often you’ll have odd-sized objects, so follow my easy
math example to give us the formula to increase the size of
anything you wish.
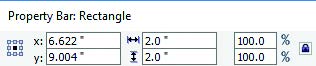
FIGURE 1: Left end of the Property Bar when a rectangle is selected
Let’s say we want our rectangle to be 1.5 times its current
size. For either the height or width, put in 2*1.5 and press
Enter. Voila, it is now 3 in. square! (You don’t have to enter
the change in both fields when the object is set to scale
proportionally.) We could do the same thing by changing the
percentage to 150%.
DIVIDING THE PIE
Now let’s use a slightly more complex formula to build a
pie chart. A pie chart needs data values that we wish to
represent, ideally adding up to 100. I’ll go with 8, 15, 19,
27, and 31. The process is the same, no matter the values.
I’ll start by drawing a circle 6 in. in diameter. The size
doesn’t matter as long as it’s a circle. On the Property Bar,
click the pie wedge symbol and the circle will turn into a
270-degree wedge. FIGURE 2 shows the “wedge” section
of the Property Bar for the starting point of our exercise.
Just in case you’ve forgotten, there are 360 degrees in
a circle. This is important, because it will be part of our
formula. We know the starting value of the wedge for the
first piece is zero. In the bottom value, we’ll type .08*360 to
represent 8% times 360 degrees. CorelDRAW does the math
to come up with 28.8. Now make a copy of the wedge using
the + key on the numeric keypad (or Ctrl+C and Ctrl+V). It
would be a good idea to fill this new piece with a different
color.
The top box will have the same value as the ending value
on the previous wedge. In our example, that’s 28.8. Now we
need to add a 15% wedge. So the bottom box will have 28.8
+ (360*.15). After pressing enter, the formula should change to 82.8, which also will be the starting value (top box) for
the next wedge.
Repeat the process for the next three wedges. Remember
the top box always gets the same value as the bottom box
from the previous wedge.
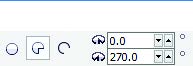
FIGURE 2: A 270-degree pie wedge represented on the Property Bar
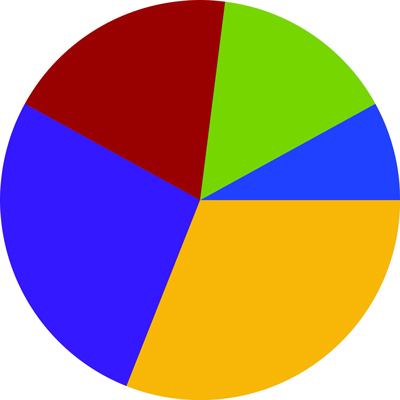
FIGURE 3: Pie chart built using CorelDRAW’s math capabilities
In the bottom box, type the following three formulas for the
next three wedges: 82.8 + (360*.19), 151.2 + (360*.27), and
360. Why no formula on the last one? If the percentages
add up to 100%, it should always end at 360. When done,
you can select all wedges and rotate the pie chart if you feel
it would look better with a different wedge on the bottom.
FIGURE 3 shows my finished pie chart, built with the values described above.
You can also use this to build bar charts. The exact method
depends on the values involved so feel free to adjust the
numbers I provide to fit the numbers in your chart. For our
example, we’re going to work with dollars and the top of the
chart should be around $10,000.
So let’s define the math to be .75 in. for every $1,000. If
the value is $6,500, you’ll move the decimal point for your
math to be 6.5 and multiply that by .75 in. (6.5*.75) for
the bar height. You’ll predefine the width of the rectangle,
which won’t change.
I started by drawing a rectangle that is 1 in. tall by .25 in.
wide. Again, the width only matters as long as the rectangle
fits the defined area. Making it 1 in. tall works for math
purposes for when we use multiplication to adjust the
height. Select a rectangle and multiply the monetary value
(with decimal point moved) by the multiplier (.75 for each
thousand).
FIGURE 4 shows a year's worth of data in bar chart form based on the formula defined above.
By using CorelDRAW to build the bar chart, I’m able to use
all of the different fills available to dress up the chart.
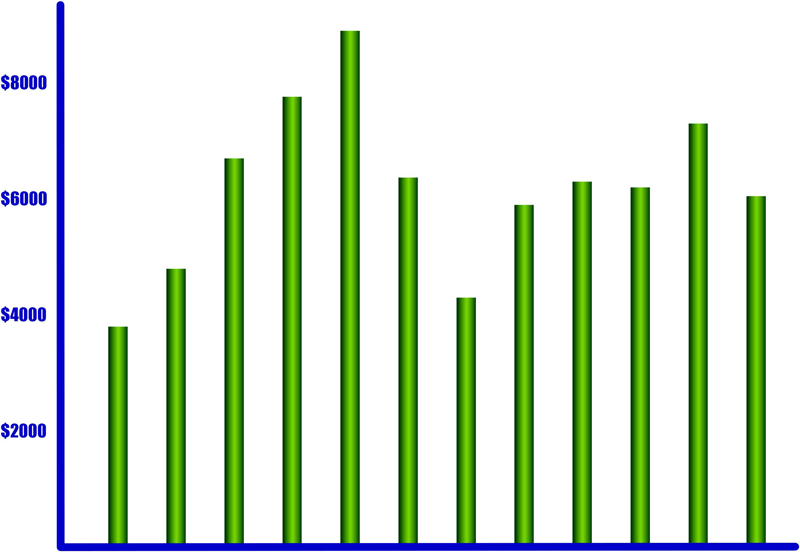
FIGURE 4: The height of the bars on this bar chart was set using math.
PUT MATH TO WORK
Now it is time to let your creativity run wild. You have the
basics of how math in CorelDRAW works. Use mathematical
symbols in any box that allows you to enter a value.
Keep in mind that you aren’t limited to simple math;
CorelDRAW can even do trigonometry. I know the boxes
support something like sin(45) to represent the sine of 45
degrees, but I don’t remember enough math to tell you why
you would want to use it!
You can experiment with different types of formulas
that may be useful to your workflow. There isn’t a full
definition of all the supported functions. Go ahead and test
something; you may find it just might work!
You can move objects, size objects, rotate objects, and
much more using various math formulas. It may seem a
little crazy at first, but soon you’ll find it is something you
use quite often.
One of my favorite uses is to place guidelines in exact
positions. The math functions make it easier to define
spacing and columns on the page. Adding one every inch is
easy. But fractions of an inch get tougher. That’s where the
math comes into play.
Once you get the hang of what you can do with math in
CorelDRAW’s number boxes, you’ll find ways to use it in
every project. The examples I’ve shown are all very simple,
and you will undoubtedly build more complex functions to
accomplish perfect sizing, spacing, and more!
Foster D. Coburn III is the author of 13 books
on CorelDRAW, the latest being CorelDRAW X6
Unleashed. He also writes the free Graphics
Unleashed Blog (www.graphics-unleashed.
com) and provides fonts, artwork, and add-ons
of interest to CorelDRAW users through the
CorelDRAW Unleashed website at https://
coreldrawunleashed.com. Connect with
Graphics Unleashed on Facebook at www.facebook.com/
graphicsunleashed and follow Foster on Twitter @fostercoburn and Instagram @fostercoburn.